Perth weekly water update - 12 November 2021
| Target | Actual | |
|---|---|---|
| November water use to date |
10.6 billion litres |
9.6 billion litres |
| Dam storage levels | N/A | 63.5% |
| Monthly streamflow into dams | N/A | 3.37 billion litres |
| November rainfall to date | 22.40mm (November average rainfall 1876-2016) | 41.24mm |
| Note: 1 billion litres = approximately 400 Olympic swimming pools. Please note the figures in this table are rounded (except for rainfall) to the nearest whole number. | ||
Water use
Average water use over the past week was 800 million litres per day – below the demand forecast of 884 million litres per day.
Daily water use for the last 5 days
| Date | Actual water use (million litres) | Forecast water use (million litres) |
|---|---|---|
| 12/11/2021 | 770 | 896 |
| 11/11/2021 | 789 | 896 |
| 10/11/2021 | 794 | 896 |
| 09/11/2021 | 800 | 896 |
| 08/11/2021 | 895 | 866 |
| Note, water use is calculated up to 8am each day for the previous 24 hour period. | ||
Since 1 July 2021 to date, we have used 89.17 billion litres of water – which is 1.51 billion litres below the forecast target for this period.
Dam levels (total for 15 dams)
The dam storage levels are slightly down on last week and are sitting at a combined 63.5 per cent* of full capacity.
*Please note some dams are filled from different sources - dam levels include the transfer of groundwater and desalinated seawater from treatment plants as well as streamflow (that comes from rainfall). As we use many different sources of water, dams are no longer an accurate indicator of the health of Perth's overall water supply situation.
Streamflow (total for 15 dams)
From 1 May 2021, the dams have received 135.9 billion litres of streamflow. The post-1975 average for the May to April period (called the streamflow year) is 177.9 billion litres.
Sprinkler roster compliance
Since 1 January 2021, we have taken a total of 4,833 actions (warnings + fines) compared with 5,025 actions for the same period in 2020.
Annual rainfall
Perth has received 881.6mm of rainfall since 1 January 2021. The average (1876-2016) rainfall for the same period to the end of November is 831.4 mm.
General water news
Yesterday, at 11am on 11 November, Water Corporation employees across the state paused to commemorate those killed in wars, conflicts and peacekeeping operations.
Water Corporation has a small connection to war history at the Cockburn Road entrance to our Woodman Point Water Resource Recovery Facility. This land was part of the naval base established in 1911, a parcel of land stretching from Coogee Beach to Point Peron, including an area at the facility.
In December 1939, the naval base land was also the training ground and home camp for the 10th Light Horse Regiment, which included 600 men with 600 of their own horses. This battalion was made of up to 75 per cent rural men from the south-west of WA, including places like York, Harvey, Bunbury, Toodyay and Waroona. Most were farm workers or farmers leaving their property in the hands of family or staff to take up national duty.
We will remember them.
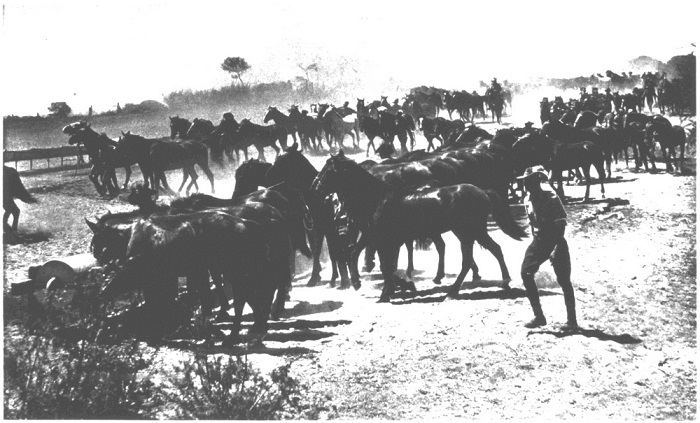
Watering the horses of the 10th Light Horse after training at Naval Base, 1940 (picture credit: City of Cockburn)